The Latin America leg of the worldwide Karol G tour wrapped up in Brazil on Friday night, just in time for Natalie to make it home for Mother’s Day! Here are highlights from the show in Lima Peru:
Where Natalie as been, all while working full-time for us!
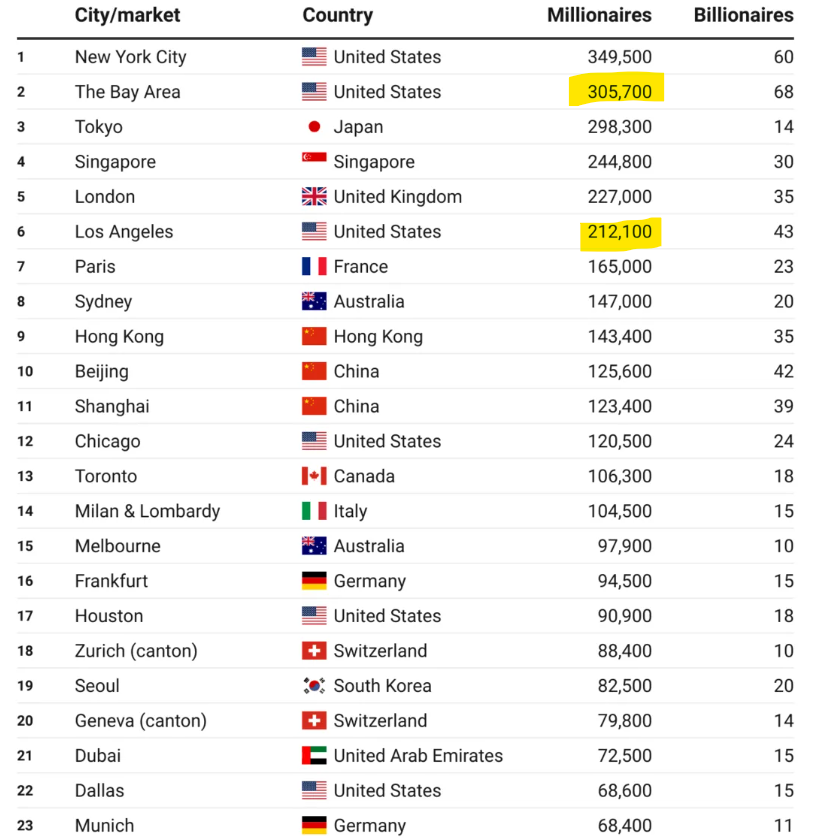
Their Top 10 states didn’t include California so obviously you should move to some place better!
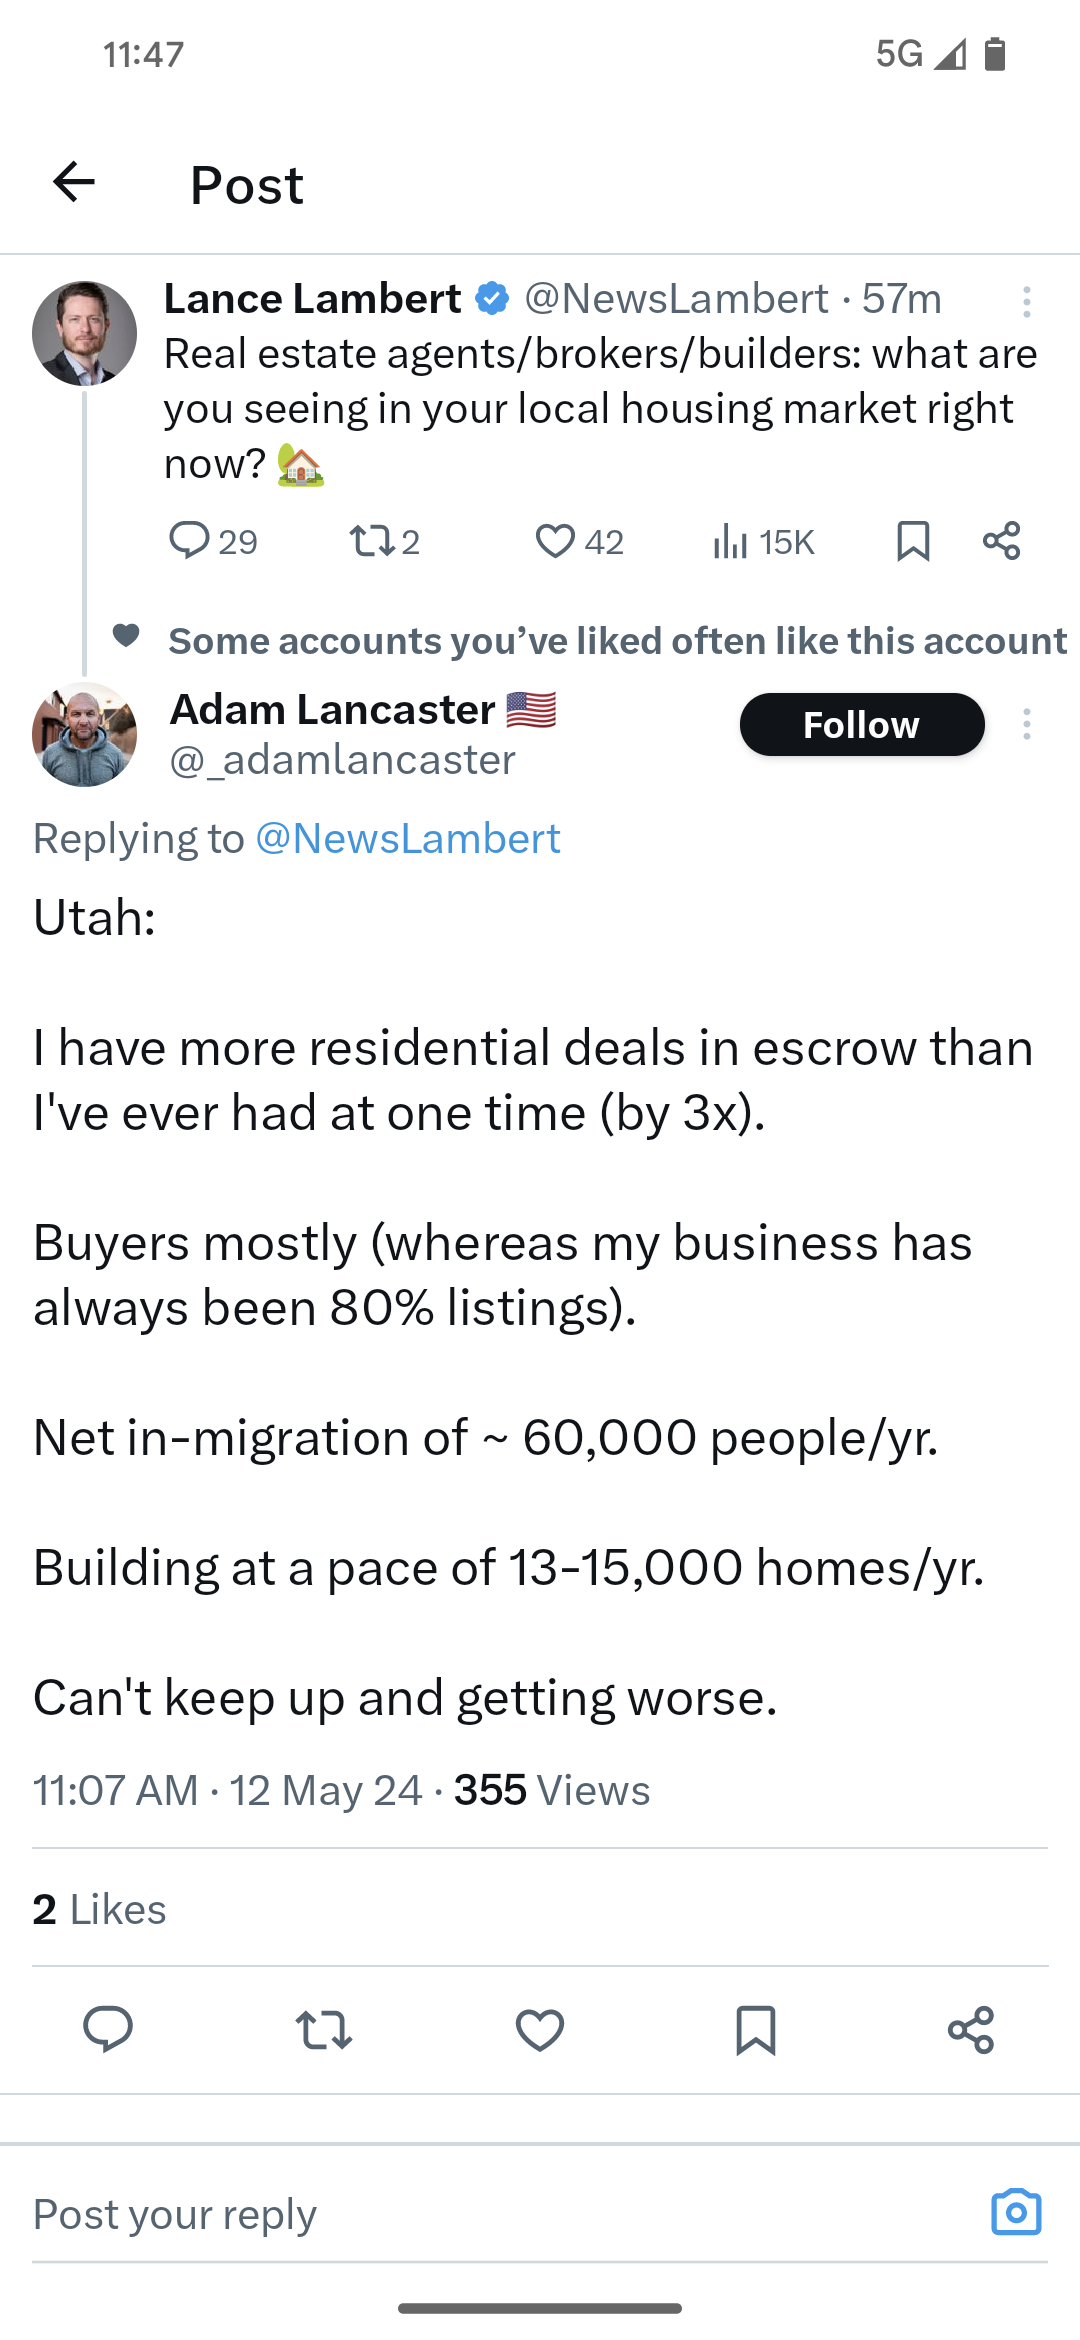
If you’re looking for a great place to live, you might want to check out Utah.
For the second year in a row, Utah was named the best state in the nation, according to the 2024 rankings from U.S. News & World Report. It ranked second in America for education, third for its economy and infrastructure, and sixth for its fiscal stability.
“Utah has a vibrant, diverse economy and unsurpassed natural beauty, but what truly sets our state apart is our people,” Utah Gov. Spencer Cox said in a statement. “We lead the nation in volunteering and charitable giving every year and this spirit of community leads to a collaborative approach to problem solving, an ecosystem that supports innovation, and a culture that strengthens families and individuals.”
States were evaluated in eight categories: health care, education, economy, infrastructure, opportunity, fiscal stability, crime and corrections, and natural environment. More than 70 metrics and tens of thousands of data points were considered, including things like employment, internet access, affordability, and public safety. (Washington, DC, was not included in the analysis.)
There was another factor that weighed in on the story I told last week about throwing in commission to make a deal. The buyers were pregnant, and hoping to buy a home to which they could move in and get settled before having their babies.
We closed escrow on April 30th, and yesterday they had their twins – congratulations!
Phew – that was close!
The best thing about being a realtor is being involved in life-changing events with people, and being able to have some positive influence on the outcome.
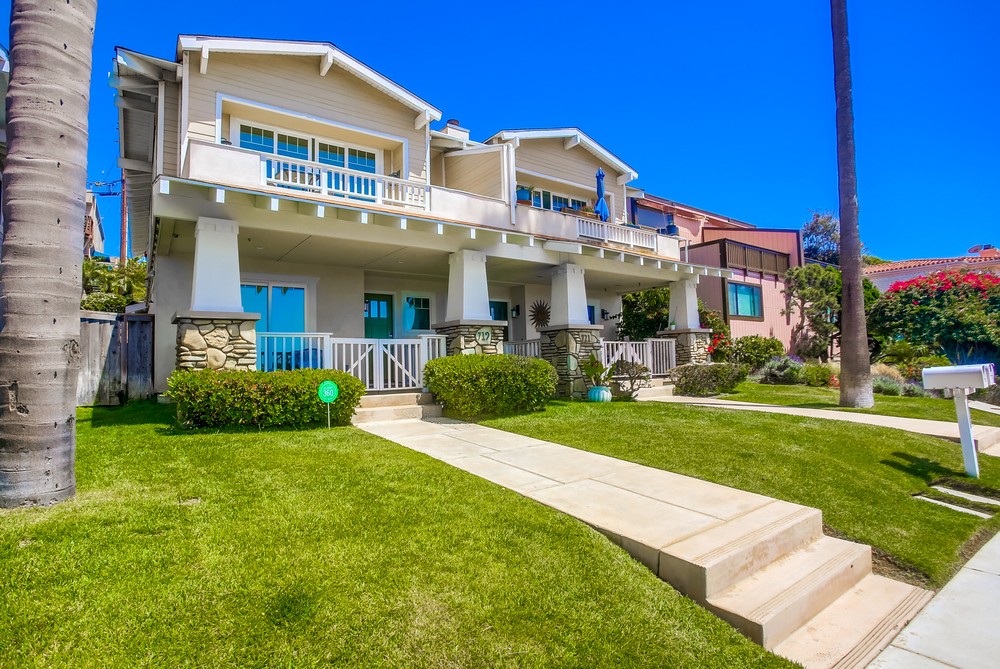
Richard’s new listing in Sorrento Valley is priced at $1,674,000, which is much lower than you see in nearby Carmel Valley. If it looks similar to vintage CV it’s because it was also built by Pardee:
A new $3,000,000+ listing hit the MLS this week that was offering a 1/2% commission to the buyer’s agent.
They also noted that to show the property, buyer-agents needed to submit proof of funds (bank statement) and pre-approval letter plus a 24-hour notice was required. Only one photo was included and no videos or matterport. In other words, they aren’t interested in incentivizing the buyer-agents – instead, they will make it as tough as possible for them to earn a living here.
It’s ok with me if you want to publicly embarrass yourself in front of your fellow realtors.
But know that you are also contributing to the demise of buyer-agents.
When other agents see that you have no regard, or respect, for what buyer-agents do, then they will learn from you – and assume that this must be how the future of commissions is going to play out. Then they will do the same thing.
Because ‘commissions are negotiable’ is such a touchy subject, nobody in the business talks about it. But we should discuss the role of the buyer-agent, and how they will soon be extinct – which is NOT good for anyone involved, especially the buyers.
There are two other new listings this month (of 63) that are offering NO buyer-agent commission.
The agents are happy to note that it will be negotiated in the offer. Your list prices are ridiculously high, you make it hard to show, and you refuse to offer ANY commission rate? Why is that a sound strategy? How does that make any business sense?
If the listing agent is unwilling to commit to paying any commission, then they must be thinking that the eventual rate negotiated with the offer will be less than 2% – because if the listing agent was willing to pay at least 2%, they’d would publicize it as a feature, wouldn’t they?
These are listing agents that prioritize the torture of the buyer-agents over what is best for their seller. It’s a very strange control/dominance issue – and they should really seek some help with that before they take another listing.
As the market slows down – and the commission debacle will be a contributing factor to the slowdown – the buyer-agents will be needed more than ever. Will listing agents adjust in time, or just blindly run off the cliff like a lemming? I don’t have a lot of faith in the former.
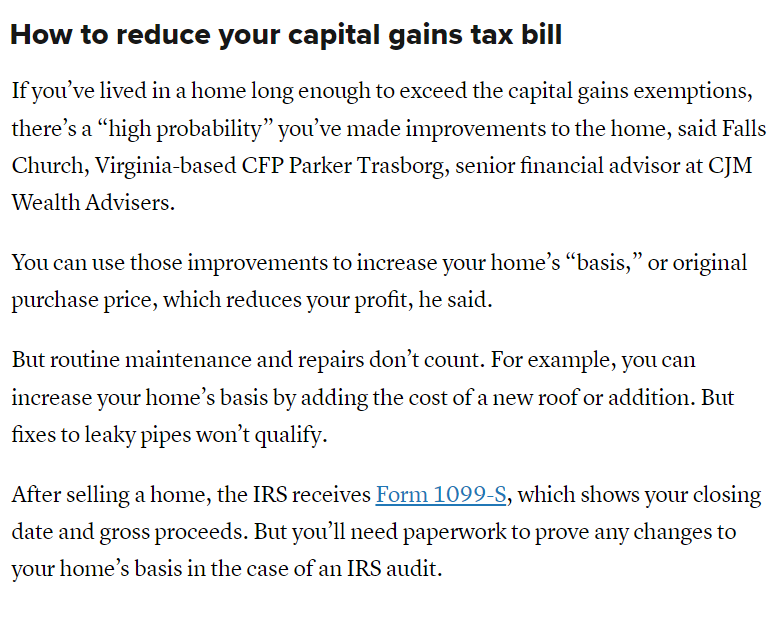
My blog post on avoiding the capital-gains tax by minimizing your annual income was wrong – the IRS includes your gains as income too (thanks WC!). It leaves home improvements as the best way to reduce the taxable gain – hang onto your receipts:
While I’m on errors and omissions……a while back I said that the Homes.com agent account costs $1,500 per month. I checked it out more closely and found that they don’t have a standard cost of service – it is based on the agent’s production. The $1,500 was for my 104 sales in the last four years (I didn’t sign up – for that kind of money, I could be driving a brand new Cadillac!).
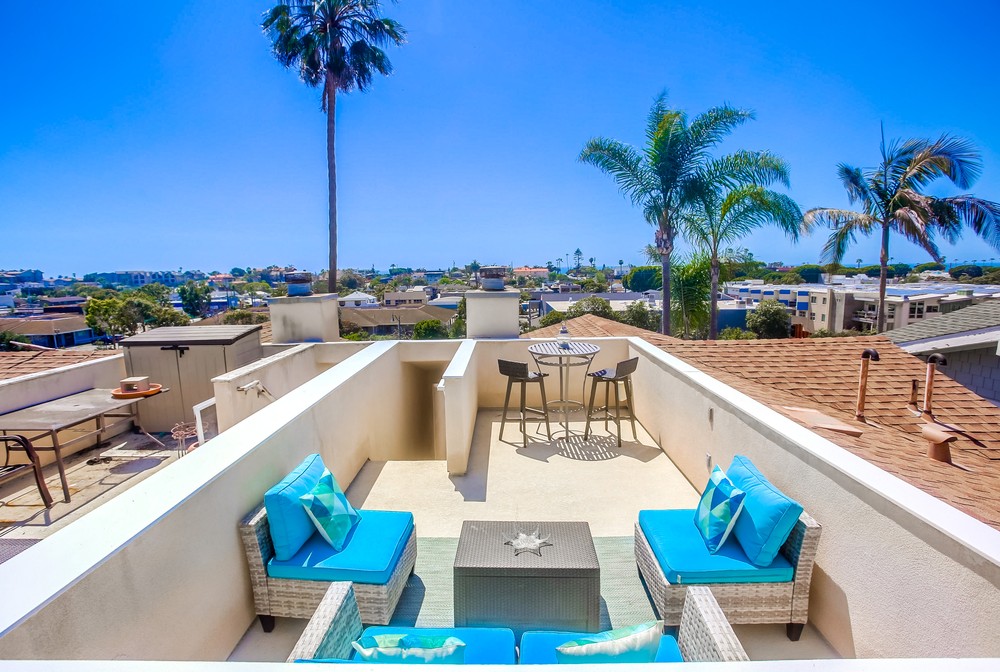
If you want to be right in the thick of things in downtown Encinitas AND be able to jump on a train in a hot minute, then I have a deal for you! The roof deck adds real living space and you can see all of downtown!